Chart
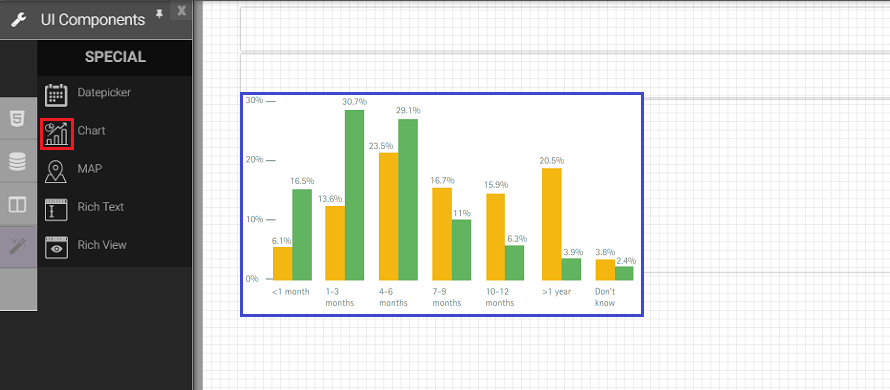
A chart also called a graph, is a graphical representation of data, in which the data is represented by symbols, such as bars in a bar chart, lines in a line chart and area chart.
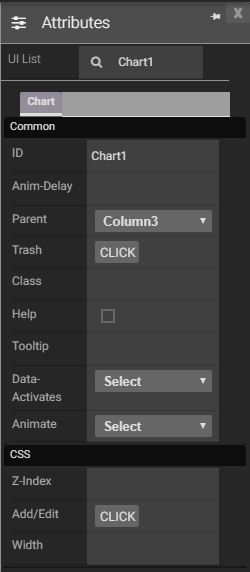
Attributes
|
|
Events
Name |
Description |
Click |
When the chart is clicked |
Double Click |
When the chart is double clicked. |
Mouse Down |
When the chart is pressed down. |
Mouse Enter |
When the mouse pointer is moves in chart while it is over. |
Mouse Leave |
When the mouse chart is moves on over a chart. |
Mouse Move |
When the mouse pointer is moving while it is over a chart. |
Mouse Out |
When the mouse pointer moves out of a chart. |
Mouse Over |
When the mouse pointer is moves on chart while it is over. |
Mouse Up |
When the mouse pointer is pressed up. |
Focus In |
When the chart is clicked. |
Focus Out |
When the mouse pointer is pressed while it is over a chart. |
Created with the Personal Edition of HelpNDoc: Easy EBook and documentation generator